
USR Insights help
USR Insights brings the numbers from all your USR apps into one place. It shows revenue, cash, pipeline, headcount and customer rating on dashboards. You can ask a question in plain words, explore a table, set an alert, and email a report every Monday. USR apps share one sign-in and one data model, so no connector is needed for them. For outside tools such as TallyPrime or Excel, USR Insights has Data sources.
See the screens
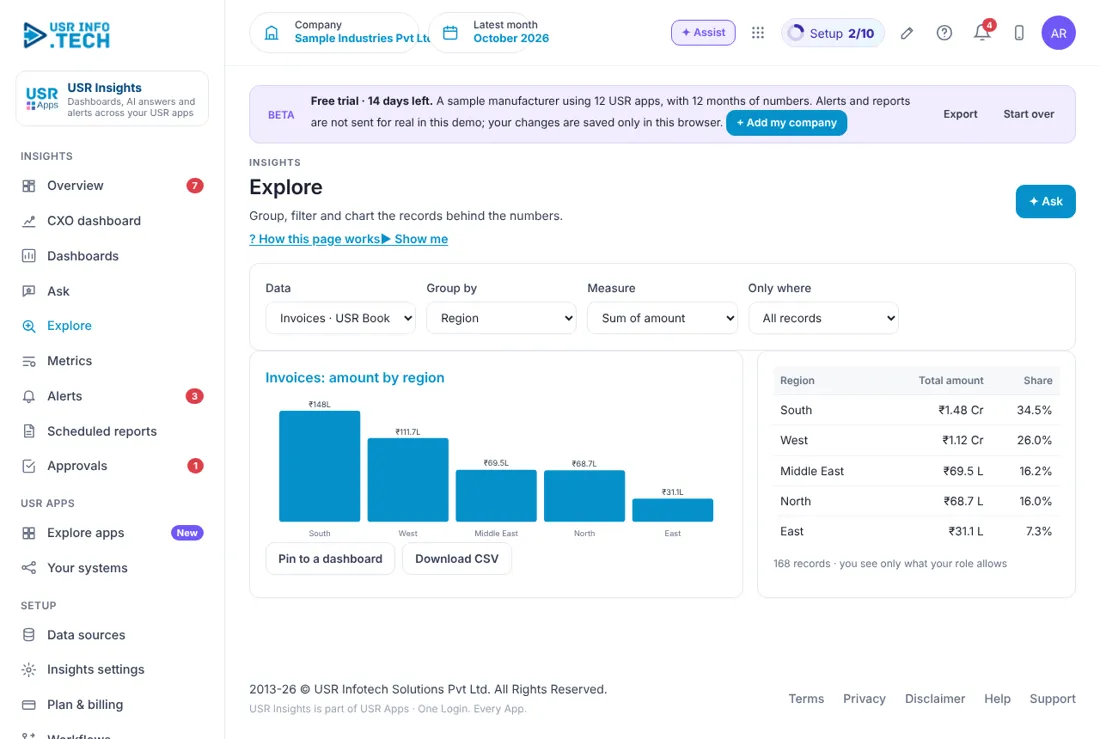
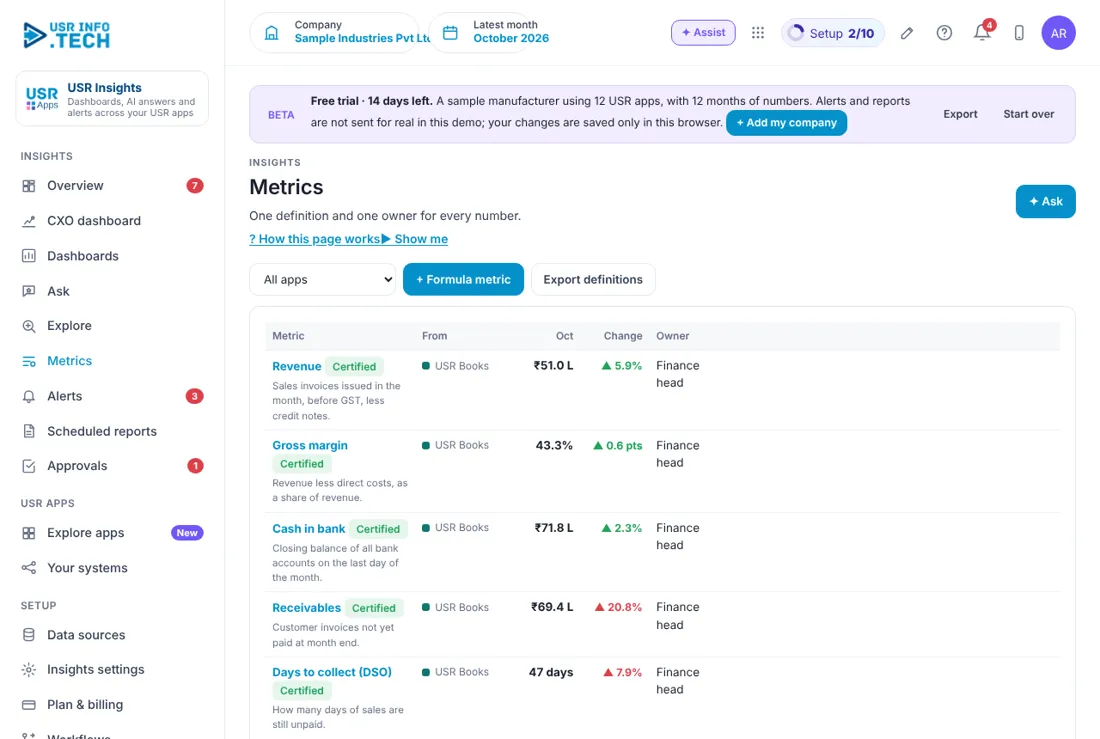
Sample company data. Screens can change as the app improves; the steps stay the same.
Welcome
USR Insights brings the numbers from all your USR apps into one place. It shows revenue, cash, pipeline, headcount and customer rating on dashboards. You can ask a question in plain words, explore a table, set an alert, and email a report every Monday. USR apps share one sign-in and one data model, so no connector is needed for them. For outside tools such as TallyPrime or Excel, USR Insights has Data sources.
- Overview and CXO dashboard: what changed and what needs a decision
- Dashboards you can share, export and print
- Ask: type a question, get an answer with figures
- Metrics with one certified meaning for each number
- Alerts to Slack, email or WhatsApp, and scheduled reports to your CA or board
- Row-level access, so managers see only their own team or region
A year in USR Insights
| When | What happens | Who |
|---|---|---|
| At the start | Check Data sources. Certify the key Metrics. Build the Management dashboard. | Admin |
| Every morning | Read the Overview. Look at the alerts that are firing. | Leaders |
| Every week | Read the Monday report. Use Ask for questions. | Leaders |
| Every month | Look at What changed. Send the finance report to your CA. | Finance head |
| Every quarter | Review alerts and targets. | Admin |
| Every year | Check the financial year start and the rupees-per-dollar rate. | Admin |
Key ideas
- Metric. A number with one clear meaning, such as Revenue or SLA met.
- Certified. A metric that its owner has approved. Everyone reads it the same way.
- Dashboard. A page of widgets for one team.
- Widget. One number or chart on a dashboard.
- Alert. A rule that tells you when a metric crosses a limit.
- Scheduled report. A dashboard sent by email on a schedule.
- Data source. Where numbers come from: a USR app or an outside tool.
- Explore. Pick data, group it and measure it yourself.
- Row-level access. Each person sees only their team, region or accounts.
- Latest month. The month the numbers are for.
One number, one meaning. Two people often quote different revenue figures. A certified metric ends that. Revenue is defined once, for example Sales invoices issued in the month, before GST, less credit notes. Its owner approves it and everyone sees the same figure.
Read, do not copy. USR Insights reads the reporting tables of your USR apps directly. You do not export and paste. The Data sources page shows the last refresh of each app.
AI sees summaries only. When you use Ask or the monthly summary, the AI receives only the summary figures for your question. It never receives individual records, and nothing is used to train models.
Alerts so you do not have to look. An alert checks a metric after every refresh. If SLA met goes below 90%, a message goes to the support channel. You see the same alerts, firing or OK, on the Alerts page.
Features step by step
5.1 Overview
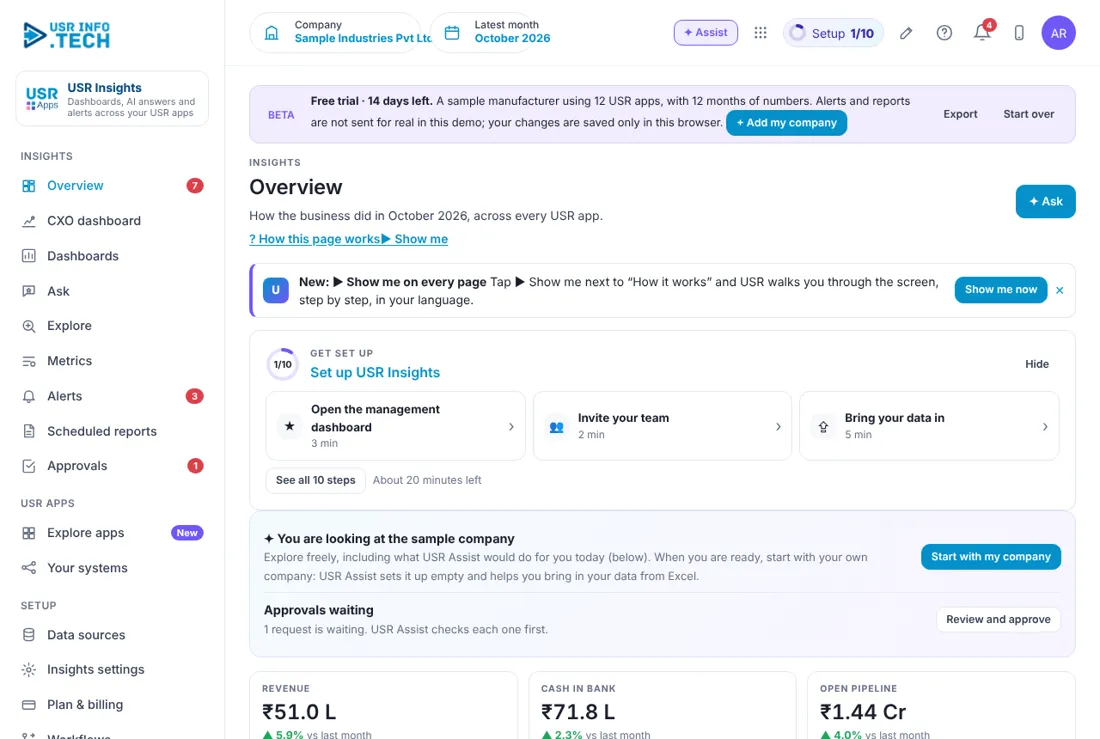
The Overview is the first page. It tells you what changed. Get set up: A checklist of 10 steps. Approvals waiting: Requests waiting for you. Key numbers: Revenue, cash in bank, open pipeline, customer satisfaction, headcount and on-time production, with change from last month. What changed: Numbers outside their usual range, each with a Look button. Write the monthly summary: AI writes a short summary from the figures. Alerts firing: Alerts that are active now. Dashboards: Quick links. Watch out: Numbers are for the Latest month shown at the top.
5.2 CXO dashboard
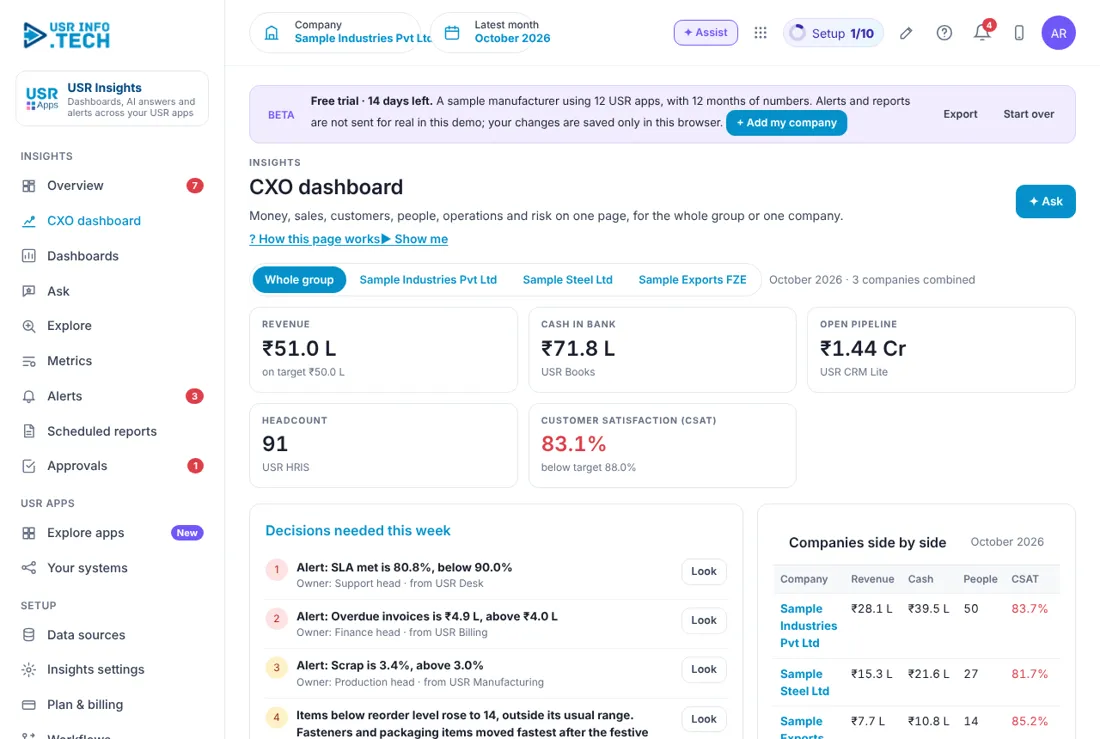
The CXO dashboard is for leaders. It shows the decisions needed this week. Whole group, company tabs: See all companies together, or one. Key numbers: Revenue, cash, pipeline, headcount and customer satisfaction against target. Decisions needed this week: Alerts and changes, each with an owner. Companies side by side: Revenue, cash, people, CSAT and overdue tasks for each company. Write the board note: AI writes a short note. Share, Email it every Monday: Send it to your board. Money, Sales, Customers, People: Groups with On track or Needs action. Watch out: The group view adds the numbers of each company.
5.3 Dashboards
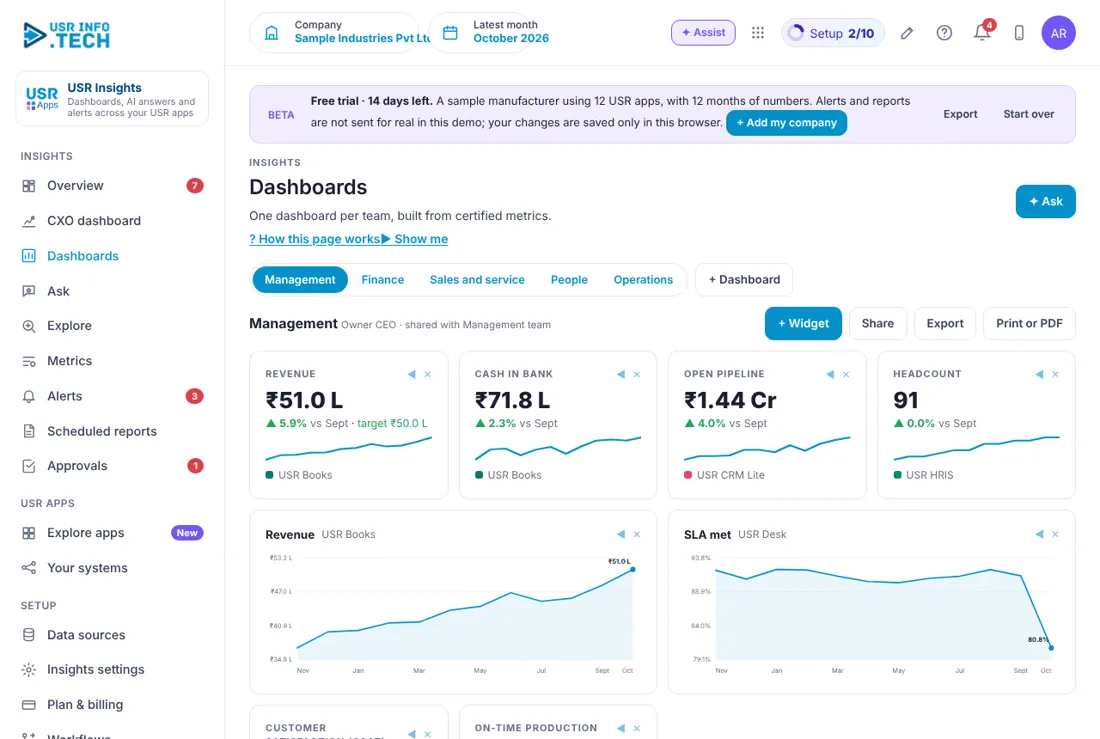
Dashboards are pages of widgets for each team. Tabs: Management, Finance, Sales and service, People, Operations. + Dashboard: Create a new dashboard. + Widget: Add a number or a chart. Share: Share with a team. Export, Print or PDF: Take the dashboard out. Widget arrows and x: Move or remove a widget. Watch out: Removing a widget does not delete the metric.
5.4 Ask
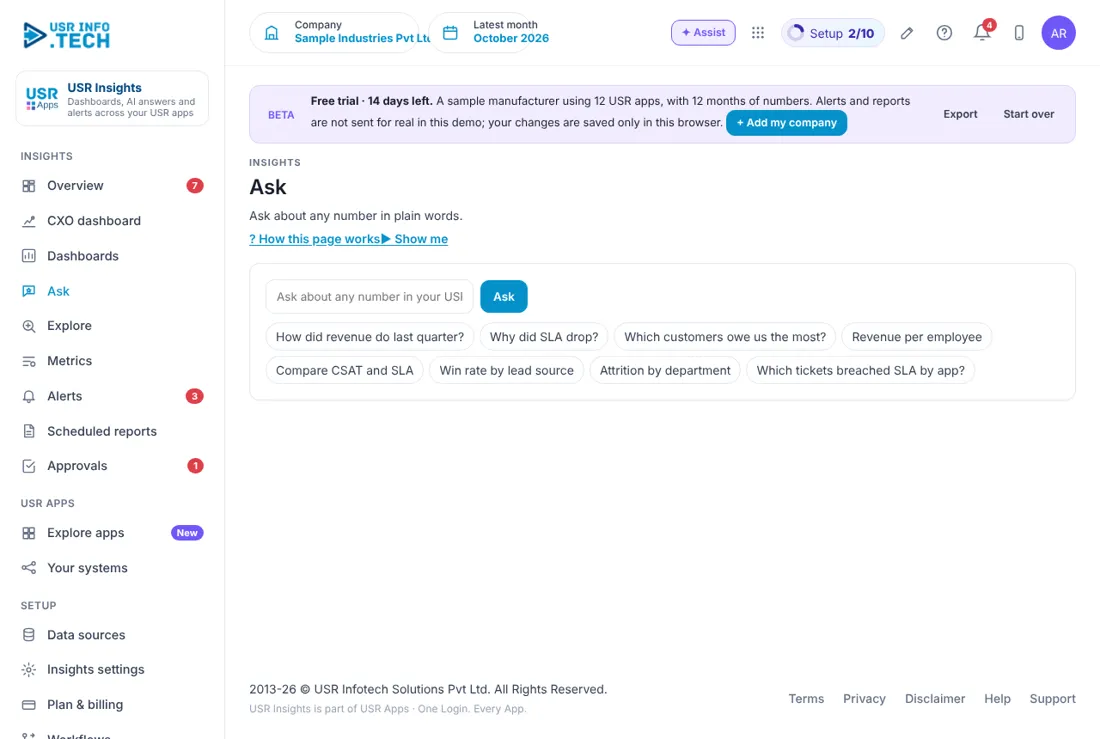
Ask answers a question in plain words. Question box: Type any question about your numbers. Ask: Get the answer. Sample questions: How did revenue do last quarter, Why did SLA drop, Which customers owe us the most and more. Watch out: The AI gets only summary figures, never individual records.
5.5 Explore
Explore lets you slice the data yourself. Data: Choose a dataset, such as Invoices from USR Books. Group by: Region, customer, month and more. Measure: Sum of amount, count and more. Only where: Filter the records. Chart and table: The result, with a share for each row. Pin to a dashboard: Keep it as a widget. Download CSV: Take the table out. Watch out: You see only what your role allows.
5.6 Metrics
Metrics is the list of numbers with their meaning. Metric: The name and a plain definition. Certified: The owner has approved it. From: The USR app it comes from. Month value and Change: The latest figure and the change. Owner: Who is responsible, such as Finance head. + Formula metric: Create a metric from a formula. Export definitions: Download the list. Watch out: Change a definition only with its owner.
5.7 Alerts
Alerts warn you when a number crosses a limit. When: The metric and the limit, such as SLA met goes below 90%. Now: The current figure. Send to: Slack, Teams, WhatsApp or email. Status: Firing, OK or Paused. Test, Pause, Delete: Try it, stop it or remove it. + Alert: Create an alert. Watch out: Slack, Teams and WhatsApp need USR Connect.
5.8 Scheduled reports
Scheduled reports send a dashboard by email. Dashboard: Which dashboard. When: For example every Monday at 9:00 am. To: A team or a person, such as your CA firm. Format: PDF or Excel. Last sent: The date of the last send. Send now: Send it at once. Watch out: Reports carry the numbers as they were at send time.
5.9 Approvals
Approvals holds requests waiting for a decision, such as certifying a metric. Waiting, Overdue, Approved this month: Counts. Approval workflows on: How many are switched on. Waiting for approval: Request, step, who it waits on, due date. Approve, Send back, Reject, Open: Your choices. Add a comment to reject. Watch out: Late approvals are escalated.
5.10 Data sources
Data sources shows where your numbers come from. USR apps: Each app, its number of metrics, Live and the last refresh. Outside tools: TallyPrime, Excel and CSV upload, Google Sheets, Zoho Books and Salesforce. Connect: Link an outside tool through USR Connect. Upload a file: A CSV with a header row becomes a dataset. Watch out: Upload only data you are allowed to use.
5.11 Insights settings
Insights settings changes how numbers are shown and how AI and access work. Show money in: Indian rupees or another currency. Rupees per US dollar: The rate used for conversion. Number style: Lakh and crore, or millions. Financial year starts: For example April. AI provider: USR AI gateway. Row-level access: Managers see only their own team, region or accounts. Watch out: Switching off row-level access shows managers more than their own team.
5.12 Plan & billing
Plan & billing shows your plan. One bill covers every USR app through USR Billing. Free: ₹0 (US$0). Three dashboards over your USR apps, 3 users. Standard: ₹1,499 (US$18) a month per company. Unlimited dashboards, alerts and scheduled reports, 10 users. Professional: ₹2,999 (US$36) a month per company. AI questions and summaries, outside sources through USR Connect, row-level access, 25 users. Enterprise: Talk to us. Many companies, your own data warehouse, private hosting, agreed SLA. Mid-market: 501 to 5,000 users. Volume pricing per user, in INR or USD. Prices: INR excludes 18% GST. Watch out: There is a 14-day Professional trial with no card needed.
If something is not working
| Problem | What to do |
|---|---|
| A number looks wrong | Open Metrics and read its definition. Check the Latest month at the top. |
| An app does not show Live | Open Data sources and check the last refresh. Ask support if it is old. |
| An alert did not arrive | Click Test on the alert. For Slack, Teams or WhatsApp check USR Connect. |
| A manager sees too much | Switch row-level access on in Insights settings. |
| Ask gives no answer | Use the name of a metric in your question, or try Explore. |
Questions people ask
Do I need to export from my apps? No. USR Insights reads USR apps directly.
Can I use Excel files? Yes. Upload a CSV or connect Excel in Data sources.
Is my data used to train AI? No. AI receives only summary figures for a question, and nothing is used to train models.
Who sees what? With row-level access on, managers see their own team, region or accounts.
Is there a trial? Yes. A 14-day Professional trial with no card needed.
Glossary
Metric: A number with one meaning. Certified: Approved by its owner. Dashboard: A page of widgets. Widget: One number or chart. Alert: A warning when a limit is crossed. Data source: Where numbers come from. Row-level access: Each person sees only their part. CXO: Chief executive, finance or operations leader.
USR Insights shares one record with these apps
No retyping between apps: data entered once flows to the next app, on the same login.
USR Insights is part of USR One. Operations Suite from ₹399 ($10) per seat a month, or every app in USR One Complete. Free for up to 10 people.
See USR One